
1.4.3How do I find average velocity on a velocity graph?
Average Velocity on a Velocity Graph
DIJIN'S TRAVELS
Dijin is late to his calculus class again! However, he is in no hurry. Below is a graph of the velocity (in meters per minute) Dijin travels during the first
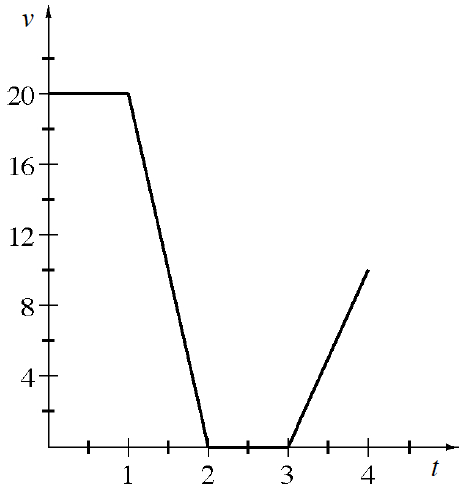
Estimate Dijin’s velocity at
minutes. What are the appropriate units for the area under the curve? Why?
What does the area under a velocity curve represent?
How far does Dijin travel during the first
minutes of his journey? What is Dijin’s average velocity during the first
minutes? Sketch Dijin’s graph on your paper. On the same set of axes, sketch the line
velocity (from part (e)) and shade the area under the average velocity curve. What shape is this? How many times did Dijin travel at his average velocity during the first
minutes of his journey? Justify your answer. If Dijin’s initial position was
meters away from his calculus classroom and he continues to travel at the same rate he was traveling when , sketch a graph of his velocity. How many minutes will it take him to get to class?
.png)
Due to eye-fatigue, a person’s reading rate decreases after
Sketch a graph of this reading rate model.
According to this model, how many words can this person read in
hours? How did you obtain your answer? What is the average number of words per hour this person reads over a five-hour interval?
Summarize your method for determining how much something has accumulated (or changed) given its rate of change. For example, given a rate such as how fast a person types, how can you calculate the number of words typed? Explain why your method works.
TRIP TO BAJA
Ms. D is on an awesome cruise aboard the pleasure boat Suluclac. One morning, at 8:00 a.m., she was informed that the boat was traveling at a rate of
She created the table below and recorded the speed of the ship at
Time (hrs) | 8:00 | 8:15 | 8:30 | 8:45 | 9:00 | 9:15 | 9:30 | 9:45 |
Speed (mph) |
Draw a speed-time graph and estimate the distance traveled between 8 a.m. and 10 a.m. Make your estimate as accurate as possible.
If the Asia-bound pleasure boat left from Catalina Island, which is
miles from Los Angeles Harbor, approximately how far from LA was the ship at 10 a.m.?
.png)
Theo left his Slope Walk graph at home. Fortunately, while he had the graph, he determined the properties shown below. Help him re-create a possible distance-time graph of his motion.
Details:
Theo walked in one direction the entire time.
His average velocity during the first half of the walk was
feet per second. His average velocity for the second half was only feet per second. He started while standing
feet from the motion detector and began to walk away from it at . He stopped when he was feet from the motion detector.

Oil is leaking out of a car at a rate of
Sketch a graph of this situation. Label the units on the axes.
Shade the area under the curve for
. What does the shaded area represent? What are the units? Use two left endpoint rectangles to approximate the amount of oil that has accumulated during the first hour.
Write the equation of the line that passes through the point
Revisit your rates of change from problem 1-143. Decide what measurement will be determined if the areas under graphs of these rates are calculated. Homework Help ✎
Use a quadratic function and an absolute value function to write a piecewise-defined function that will produce the graph shown below. Homework Help ✎
.png)
Write a complete set of approach statements for
A flag is defined by the region between the
If
Graph
and write its domain in set notation. Write an equation the end-behavior function of
.
A focus of this course will be determining maximum and minimum values of a function on a given interval. However, you already have the skills to do this for certain functions. On your paper, sketch
TEST DRIVE
Sarah wants to buy a new car and is deciding between two models. She has convinced both car dealerships to allow her to test drive each car for
Coronado Speedster

D.O. Sensation
.png)
Sarah finds that both cars performed exceptionally well and she will be very happy with either one. She decides to make her final decision based on the gas mileage of each model. Her test drive of the Coronado Speedster used
.png)